I'm trying to write automated program to convert excel table to hierarchical graph.
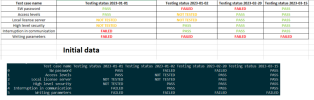
I load my excel table and have such data:
Test case name Testing status 2023-01-01 Testing status 2023-01-02 Testing status 2023-02-20 Testing status 2023-03-15
0 SW password PASS FAILED FAILED PASS
1 Access levels PASS NOT TESTED PASS PASS
2 Local license server NOT TESTED NOT TESTED PASS PASS
3 High level security NOT TESTED PASS PASS PASS
4 Interruption in communication FAILED PASS PASS PASS
5 Writing parameters FAILED FAILED FAILED FAILED
Then I use pd.MultiIndex to group data and get result I want
MultiIndex([( 'SW password', 'PASS', 'FAILED', ...),
( 'Access levels', 'PASS', 'NOT TESTED', ...),
( 'Local license server', 'NOT TESTED', 'NOT TESTED', ...),
( 'High level security', 'NOT TESTED', 'PASS', ...),
names=['Test case name', 'Testing status 2023-01-01', 'Testing status 2023-01-02', 'Testing status 2023-02-20', 'Testing status 2023-03-15'])
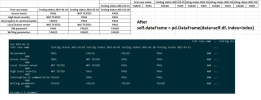
After this I create a DataFrame object and see that appears additional corrupted columns. How to fix it ?
Test case name ... Testing status 2023-03-15
Test case name Testing status 2023-01-01 Testing status 2023-01-02 Testing status 2023-02-20 Testing status 2023-03-15 ...
SW password PASS FAILED FAILED PASS NaN ... NaN
Access levels PASS NOT TESTED PASS PASS NaN ... NaN
Local license server NOT TESTED NOT TESTED PASS PASS NaN ... NaN
High level security NOT TESTED PASS PASS PASS NaN ... NaN
Interruption in communication FAILED PASS PASS PASS NaN ... NaN
Writing parameters FAILED FAILED FAILED FAILED NaN ... NaN
[6 rows x 5 columns]
I load my excel table and have such data:
Python:
self.df = pd.read_excel(self.file, sheet_name="Checklist", engine="openpyxl", header=[10])
print(self.df)0 SW password PASS FAILED FAILED PASS
1 Access levels PASS NOT TESTED PASS PASS
2 Local license server NOT TESTED NOT TESTED PASS PASS
3 High level security NOT TESTED PASS PASS PASS
4 Interruption in communication FAILED PASS PASS PASS
5 Writing parameters FAILED FAILED FAILED FAILED
Then I use pd.MultiIndex to group data and get result I want
Python:
index = pd.MultiIndex.from_frame(self.df)
print(index)( 'Access levels', 'PASS', 'NOT TESTED', ...),
( 'Local license server', 'NOT TESTED', 'NOT TESTED', ...),
( 'High level security', 'NOT TESTED', 'PASS', ...),
names=['Test case name', 'Testing status 2023-01-01', 'Testing status 2023-01-02', 'Testing status 2023-02-20', 'Testing status 2023-03-15'])
After this I create a DataFrame object and see that appears additional corrupted columns. How to fix it ?
Python:
self.dataFrame = pd.DataFrame(data=self.df, index=index)
print(self.dataFrame)
Test case name ... Testing status 2023-03-15
Test case name Testing status 2023-01-01 Testing status 2023-01-02 Testing status 2023-02-20 Testing status 2023-03-15 ...
SW password PASS FAILED FAILED PASS NaN ... NaN
Access levels PASS NOT TESTED PASS PASS NaN ... NaN
Local license server NOT TESTED NOT TESTED PASS PASS NaN ... NaN
High level security NOT TESTED PASS PASS PASS NaN ... NaN
Interruption in communication FAILED PASS PASS PASS NaN ... NaN
Writing parameters FAILED FAILED FAILED FAILED NaN ... NaN
[6 rows x 5 columns]
Attachments
Last edited: